

People teams need five data layers from AI learning tools: adoption metrics (who uses it and how often), engagement depth (quality of interactions), skill development (behavior change), business impact (performance outcomes), and organizational insights (patterns across teams). Traditional learning platforms can't answer whether anyone got better at their job.
Adoption metrics show whether your learning investment reaches the people who need it. Daily and weekly active users segmented by role, level, and location reveal where engagement is strong and where it fails.
Frequency matters more than raw numbers. Managers engaging 2-3 times per week demonstrate habit formation. Those appearing only during performance review season indicate superficial adoption.
Time to first value measures how quickly new users engage after onboarding. Drop-off analysis identifies where and why users disengage.
Tools that integrate into Slack, Teams, or Zoom capture adoption data automatically. Managers don't need to log into another platform.
Engagement depth separates learning from checkbox compliance. Conversation length, complexity, and follow-up patterns reveal whether users treat the tool as a quick answer machine or a development partner.
Topic distribution shows what challenges managers work on (not what HR assumes they need). Return rate indicates real application—users coming back for the same challenge signal they're implementing advice.
Skill development data must go beyond self-reported confidence. Before-and-after comparisons on specific competencies (delegation, feedback quality, goal-setting) provide concrete evidence of improvement.
Application rate tracks whether managers use frameworks taught in training. Skill progression over weeks and months replaces post-training snapshots with longitudinal data. 360-degree feedback integration shows how direct reports perceive changes.
Business impact metrics connect learning investments to outcomes that matter to the C-suite. Manager effectiveness scores correlated with coaching engagement show whether development translates to performance. Team performance indicators (retention, productivity, promotion rates) show downstream effects of better management.
Time savings quantify efficiency gains from better meetings and faster decisions. Quality improvements capture better feedback conversations and clearer goal alignment. Leading indicators provide early signals of disengagement, conflict, or performance issues before they escalate.
Organizational insights surface patterns invisible at the individual level. Skill gap analysis by department, level, or location reveals where to concentrate development resources. Cultural health indicators show what topics surface most frequently, providing real-time pulse data that replaces quarterly surveys.
Training needs identification guides L&D investment decisions with usage data. Comparative benchmarks show how different teams or cohorts perform. Predictive signals identify which teams show early warning signs of turnover or disengagement.
Traditional learning management systems track completions and time-on-platform. A 95% completion rate is useless if those managers still avoid difficult conversations or lose top performers.
The Center for Creative Leadership's research on the 70-20-10 model found that people learn 70% through on-the-job experience, 20% through social learning, and 10% through formal training. Most L&D budgets invert this, pouring money into classroom training that accounts for the smallest slice of learning.
Traditional platforms measure consumption. Better tools measure application. That's the difference between knowing someone watched a video on feedback and knowing they gave better feedback in yesterday's 1:1.
What Traditional Platforms Measure vs. What Better Tools Can Measure:
Data Breakdown:
• Traditional LMS: Course completions | Better Tools: Skill application frequency
• Traditional LMS: Time on platform | Better Tools: Conversation quality
• Traditional LMS: Quiz scores | Better Tools: Behavior change over time
• Traditional LMS: Satisfaction ratings | Better Tools: Performance outcomes
• Traditional LMS: Annual snapshots | Better Tools: Continuous insights
Data visibility must balance insight with protection. HR leaders should demand SOC2 Type 2 compliance as a baseline. Customer data must never train AI models (this protects both employee privacy and competitive advantage).
Anonymized aggregation protects individual privacy while surfacing organizational patterns. Sensitive topic escalation routes workplace issues requiring human expertise to appropriate resources. Organization-specific controls allow customization of what data is captured and how it's used.
The platform should provide anonymized, aggregated insights to HR leaders while protecting individual conversation privacy. Managers must trust the tool enough to use it for genuine challenges.
Request a live demo of the analytics dashboard with real customer data (anonymized). Ask vendors to show you the five data layers in action: adoption, engagement, skill development, business impact, and organizational insights. Request sample reports showing how the platform identifies skill gaps, tracks behavior change, and measures ROI.
Demand integration capabilities with your existing HR tech stack. The platform should connect with your HRIS, performance management system, and communication tools without requiring manual data entry. Ask about API access for custom reporting and data export options.
Verify governance standards through documentation, not promises. Request SOC2 Type 2 certification, data processing agreements, and clear policies on model training. Ask how the platform handles sensitive topics and what escalation processes exist.
Test the platform's ability to answer strategic questions: Which teams need intervention? Where should we invest L&D resources? How do we know if coaching is working? The best platforms answer these questions with data, not dashboards.
Ask vendors for validation studies or customer references that demonstrate behavior change measurement. Request specifics on methodology: how does the platform measure skill improvement? What's the validation process? How do they distinguish correlation from causation in business impact metrics?
• Traditional LMS metrics (completions, time-on-platform) don't measure behavior change. Demand adoption, engagement depth, skill development, business impact, and organizational insights instead.
• Tools that integrate into daily workflows (Slack, Teams, Zoom) capture more engagement than standalone platforms requiring separate logins.
• Behavior change matters more than self-reported confidence. Look for platforms that track real application of skills over weeks and months.
• Business impact metrics (retention, productivity, manager effectiveness scores) prove ROI to the C-suite. Without this connection, L&D remains a cost center.
• SOC2 Type 2 compliance and policies against training on customer data are non-negotiable. Protect employee privacy and competitive advantage while gaining visibility.
• Ask vendors for validation studies and methodology documentation. Claims about behavior change measurement require evidence, not just dashboards.
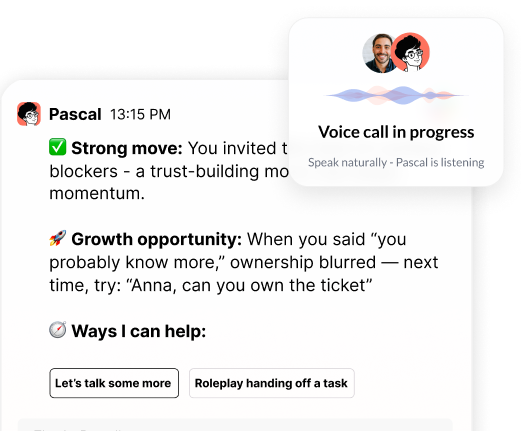
The gap between learning consumption and behavior change has plagued HR leaders for decades. Tools that measure what matters—whether managers improve at the work that drives team performance—change how organizations develop their people. Pascal by Pinnacle delivers real-time coaching and behavior tracking inside Slack, Teams, and meetings.
Header photo by Annie Spratt on Unsplash

.png)
.webp)
“Thank you for setting the great foundation for my promotion; now I have a plan!"

Curious to see how AI Coaching can 10X the impact and scale of your development initiatives. Book a demo today for: