

The short answer: Five data layers matter: real-time adoption metrics, behavioral change indicators, organizational pattern insights, performance predictors, and ROI measurements. Traditional platforms track completion rates. AI tools should track whether people actually change how they work.
The reality check: Most "AI learning platforms" can't deliver this yet. This guide describes what's possible with purpose-built AI coaching systems (like Pascal), not what you'll find in every LMS with a chatbot. Ask vendors for proof.
• Traditional learning platforms measure inputs (who attended training). AI platforms should measure outcomes (who changed behavior)
• Behavioral change tracking requires observing actual work, not self-reported surveys
• Organizational pattern insights reveal skill gaps across the company in real-time
• Strong platforms correlate learning engagement with business outcomes: retention, promotion readiness, team performance
• Privacy matters: understand how platforms observe behavior without surveillance
Traditional learning management systems report completion rates, time spent, and quiz scores. A 2024 Gartner study found that 87% of HR leaders cannot connect learning investments to business outcomes.
The gap is visibility into behavior change. Systems track what people learned, not what they do differently at work. Completion metrics create false confidence: 90% course completion doesn't mean 90% skill acquisition.
The privacy question: AI platforms that observe workplace behavior must explain how. Recording all meetings? Manager self-reporting? Integration with existing tools? Demand specifics. Employees deserve transparency about what's tracked and how data is used.
Data Breakdown:
• Data Layer: Adoption and Engagement | What It Measures: Who uses the tool, frequency, context | Why It Matters: Shows if tool becomes trusted resource vs. underutilized platform | Key Questions for Vendors: "Show me a sample engagement dashboard. How do you track usage by role, level, and department?"
• Data Layer: Behavioral Change Indicators | What It Measures: Evidence that learning translates to different workplace actions | Why It Matters: Proves actual skill application, not just knowledge acquisition | Key Questions for Vendors: "How do you observe actual workplace behavior? What data sources do you use?"
• Data Layer: Organizational Pattern Insights | What It Measures: Company-wide trends, skill gaps by function, common coaching topics | Why It Matters: Functions as continuous training needs analysis | Key Questions for Vendors: "How do you aggregate individual data while protecting privacy?"
• Data Layer: Performance Predictors | What It Measures: Leading indicators connecting learning to business outcomes | Why It Matters: Enables proactive intervention before problems escalate | Key Questions for Vendors: "Show me evidence that your platform predicts retention risk or promotion readiness."
• Data Layer: ROI and Business Impact | What It Measures: Clear connections between investment and measurable results | Why It Matters: Justifies budget and proves value to leadership | Key Questions for Vendors: "Show me ROI calculations from existing customers. What assumptions do those calculations make?"
Who uses the tool, how frequently, and in what contexts. Real-time visibility shows whether the tool becomes a trusted resource or another underutilized platform.
AI-powered platforms track adoption with greater sophistication than traditional systems. Rather than counting logins, they analyze usage patterns to understand when and why employees seek support.
What to ask vendors: "Show me a sample engagement dashboard. How do you track usage by role, level, and department? Can I see which features get used and which get ignored?"
Engagement patterns reveal organizational dynamics. If senior leaders rarely engage while individual contributors show high adoption, that signals a culture problem. If one department shows lower engagement, that department may need additional change management support.
Evidence that learning translates to different actions at work. The critical question: does the platform observe whether managers actually delegate differently after coaching, or just whether they completed a delegation module?
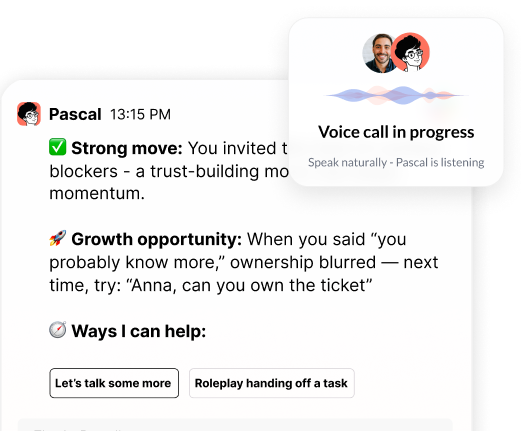
How this works in practice: At Pinnacle, Pascal observes manager conversations (with consent) and documents behavioral shifts. A manager learning to give better feedback receives coaching, then Pascal tracks whether subsequent one-on-ones include specific, actionable guidance rather than vague praise. It measures whether the manager asks more questions and listens more actively.
What to ask vendors: "How do you observe actual workplace behavior? What data sources do you use? How is employee privacy protected? Show me a before-after behavioral comparison from a real customer."
Red flags: Platforms that rely solely on self-reported application or delayed surveys that ask employees to recall whether they used new skills. These don't measure actual behavior change.
Aggregated, anonymized data revealing company-wide trends, skill gaps by function or level, and common coaching topics. This functions as continuous training needs analysis.
When aggregated across hundreds of employees, coaching interactions reveal collective challenges and development needs. These patterns often surface issues that would never appear in traditional needs assessments.
For example, if managers across multiple departments suddenly increase engagement with coaching on remote team management, that signals an organizational shift requiring broader support. If engineering managers consistently seek guidance on cross-functional collaboration while marketing managers focus on stakeholder management, that reveals function-specific development needs.
What to ask vendors: "How do you aggregate individual data while protecting privacy? Can managers be re-identified from aggregated reports? Show me a sample organizational insights report."
Leading indicators connecting learning engagement to business outcomes: retention risk, promotion readiness, team performance scores, and manager effectiveness ratings.
Retention risk prediction illustrates this capability. Traditional analytics identify retention problems after employees resign. AI learning platforms detect early warning signs by analyzing engagement patterns and coaching topics. When a previously engaged manager stops using development resources, that signals potential disengagement.
What to ask vendors: "Show me evidence that your platform predicts retention risk or promotion readiness. What's the correlation between coaching engagement and team outcomes in your customer data?"
Important limitation: Correlation isn't causation. Engaged managers may perform better because they're already strong performers who seek development, not because the platform made them better. Look for vendors who acknowledge this and use control groups in their research.
Clear connections between learning investment and measurable results: time saved through automated coaching, reduced need for external coaching programs, faster manager ramp time, and improved performance review quality.
Time savings represent immediate ROI. When managers access just-in-time coaching for specific situations rather than waiting for scheduled training or external coach availability, they resolve challenges faster.
Real numbers from Pinnacle customers: Organizations with 200 managers reduced external coaching spend from $400,000 annually to $120,000 while increasing coaching access. New managers reached effectiveness milestones in 8-12 months instead of 15-18 months.
What to ask vendors: "Show me ROI calculations from existing customers. What assumptions do those calculations make? Can you help me model ROI for our specific situation?"
AI-powered learning platforms generate different data because they observe actual work, not just training completion. Traditional analytics measure inputs. AI analytics measure outcomes.
Data Breakdown:
• Traditional Learning Analytics: Measures course completion rates | AI-Powered Learning Analytics: Measures behavioral change in actual work
• Traditional Learning Analytics: Tracks time spent in training | AI-Powered Learning Analytics: Tracks skill application frequency
• Traditional Learning Analytics: Reports quiz scores | AI-Powered Learning Analytics: Documents performance improvements
• Traditional Learning Analytics: Annual needs assessment | AI-Powered Learning Analytics: Real-time skill gap identification
• Traditional Learning Analytics: Generic content recommendations | AI-Powered Learning Analytics: Contextual, personalized coaching
• Traditional Learning Analytics: Quarterly completion reports | AI-Powered Learning Analytics: Daily behavioral data
• Traditional Learning Analytics: Activity tracking | AI-Powered Learning Analytics: Outcome measurement
• Traditional Learning Analytics: Self-reported application | AI-Powered Learning Analytics: Observed workplace behavior
The critical difference is contextual awareness. Generic learning platforms don't know your organizational competencies, team structures, or business challenges. Purpose-built AI coaching platforms integrate with your HRIS and understand your company's specific leadership frameworks.
AI coaches provide daily behavioral data. Traditional training gives quarterly completion reports. This shift from activity tracking to outcome measurement transforms how People teams prove value.
The integration question: By connecting with HRIS platforms, performance management systems, and communication tools, AI coaches understand organizational context. They know reporting structures, tenure, role transitions, and performance history. This enables personalized coaching that addresses each manager's specific situation.
What to ask vendors: "Which systems do you integrate with? How do you use that data? What happens to our data if we cancel the contract?"
Not all AI learning metrics carry equal strategic weight. Prioritize metrics that directly connect to business outcomes and talent strategy goals.
Sustained engagement rate: What percentage of users engage weekly after 90 days? This indicates whether the platform becomes a trusted daily resource or another underutilized tool. Strong platforms maintain 60-70% weekly active usage among target users after six months.
Behavior change documentation: Can the platform show before-after evidence of skill application in actual work? Demand concrete evidence: analysis demonstrating increased use of open-ended questions, documentation of more frequent recognition, or evidence of clearer goal-setting.
Manager effectiveness correlation: Does coaching engagement predict improved direct report satisfaction, retention, or performance? Strong platforms show 15-25% improvements in direct report satisfaction and 20-30% reductions in regrettable turnover among teams whose managers actively use coaching.
Time-to-competency reduction: How much faster do new managers reach effectiveness milestones? Strong platforms reduce time-to-competency by 30-40%, meaning teams reach full productivity faster.
Skill gap identification speed: How quickly does the platform surface emerging development needs? Traditional needs assessment happens annually. AI platforms identify emerging skill gaps within weeks by analyzing coaching interaction patterns.
ROI transparency: Can you calculate cost per manager developed compared to traditional coaching, training programs, or unfilled HRBP positions? If AI coaching costs $200 per manager annually and delivers outcomes comparable to external coaching at $3,000-5,000 per manager, the ROI is clear.
Avoid platforms that only report completion rates, time spent in system, or content consumption without connecting those activities to behavioral outcomes or business results.
When evaluating AI learning platforms, most vendors will claim these capabilities. Here's how to separate real functionality from vaporware:
Demand proof: Ask for customer case studies with specific metrics. Request live demos showing actual behavioral change tracking, not hypothetical examples. Talk to reference customers about what the platform actually delivers versus what was promised.
Understand the privacy model: How does the platform observe behavior? What requires employee consent? How is data stored and protected? What compliance certifications does the vendor hold?
Test the integration: Most platforms claim HRIS integration. Ask which specific systems they integrate with, what data flows in each direction, and how long implementation takes.
Evaluate the AI claims: "AI-powered" means different things. Some platforms use AI for content recommendations. Others use it for conversational coaching. Some analyze behavioral patterns. Understand what the AI actually does.
Consider implementation barriers: Behavioral observation requires infrastructure most companies don't have. If a platform claims to track meeting behavior, understand what that requires from your organization (meeting bots, recording policies, legal review, change management).
Start with a pilot: Test the platform with 50-100 managers before company-wide rollout. Measure the five data layers during the pilot. Compare results to a control group. Use pilot data to negotiate pricing and implementation support.
AI learning platforms should deliver visibility into behavioral change, not just training completion. The five data layers described here represent what's possible with purpose-built AI coaching systems, not what you'll find in every platform claiming AI capabilities.
Demand proof. Ask hard questions. Understand the privacy implications. Start small and measure results.
At Pinnacle, Pascal delivers these five data layers by observing actual manager conversations (with consent), tracking behavioral change over time, and correlating coaching engagement with team outcomes. We integrate with your HRIS to understand organizational context and provide real-time insights into emerging skill gaps.
Ready to see what AI coaching data actually looks like? Request a demo to explore sample dashboards, behavioral change reports, and ROI calculations from existing customers. We'll show you exactly how Pascal tracks the metrics that matter.
Header photo by Vitaly Gariev on Unsplash

.png)
.webp)
“Thank you for setting the great foundation for my promotion; now I have a plan!"

Curious to see how AI Coaching can 10X the impact and scale of your development initiatives. Book a demo today for: