

AI coaching proves its value through three measurement layers: adoption signals, behavioral changes managers apply in their work, and business outcomes like retention and team performance. This framework shows you what to measure and when.
Traditional learning metrics capture the wrong things. Completion rates and satisfaction scores measure training events. AI coaching works through continuous micro-interventions: a message before a difficult conversation, real-time feedback after a meeting, guidance on a performance review.
The value compounds through repeated application. Impact shows up in manager behavior changes that direct reports notice. ROI comes from preventing problems (bad feedback conversations, turnover) as much as creating wins. LMS metrics like logins and time spent miss this entirely.
Data Breakdown:
• Traditional L&D: Completion rates | AI Coaching: Behavior change frequency
• Traditional L&D: Satisfaction surveys | AI Coaching: Direct report improvement scores
• Traditional L&D: Annual training hours | AI Coaching: Real-time application moments
• Traditional L&D: Quiz scores | AI Coaching: Manager effectiveness lift
Effective measurement requires tracking adoption signals that predict sustained engagement, behavioral change metrics that show skill development, and business outcomes that justify investment.
These early signals predict whether managers will keep using the tool.
Repeat usage rate measures the percentage of managers returning within 7 days of first use. At Pinnacle, we see sustained engagement when this hits 50% or higher in the first month.
Conversation depth tracks average exchanges per coaching session. Five or more back-and-forth interactions indicate meaningful engagement. Shallow conversations with 1–2 exchanges suggest managers aren't finding value.
Cross-context usage shows managers using coaching across multiple scenarios (1:1 prep, feedback delivery, conflict resolution) within the first month. Single-use-case adoption rarely expands.
These indicators show whether coaching translates to skill development.
Direct report improvement surveys use short, frequent pulse questions: "Has your manager's [specific skill] improved in the past 30 days?" We recommend monthly surveys with 3–5 questions focused on observable behaviors (asks better questions, gives specific feedback, delegates clearly). Response rates above 60% provide reliable data.
Behavior frequency tracking measures how often managers apply coached behaviors. Track through manager self-reports (acknowledge the bias but use them as directional indicators) or direct observation data where available. Focus on 3–5 critical behaviors aligned to your organization's leadership model.
Manager Net Promoter Score asks direct reports "How likely are you to recommend your manager to a colleague?" tracked monthly. This measures overall manager effectiveness from the direct report perspective. Early adopter data shows 10–15 point lifts among managers who engage consistently.
Skill application speed measures time from coaching moment to observable behavior change. High-quality coaching shows impact within one week. If behavior changes take longer, the coaching may lack specificity or relevance.
These metrics connect coaching investment to organizational priorities.
Retention impact compares regrettable attrition (voluntary departures of high performers) for teams with coached managers versus control groups. Establish your control group at launch—identify comparable teams not using AI coaching and track the same metrics. The difference between coached and non-coached groups provides your strongest evidence.
Performance review quality measures direct report ratings of review fairness, specificity, and developmental value. Add 2–3 questions to your post-review survey focused on these dimensions.
Time savings tracks hours saved on performance review prep, 1:1 planning, and HR escalations. Measure through manager time logs or estimates. We've seen prep time reductions of 30–50% when managers use AI coaching for review preparation, though your results will vary based on your current process complexity.
Promotion readiness measures the percentage of managers rated "ready now" or "ready in 6 months" for next-level roles. Compare year-over-year data for coached versus non-coached populations.
Data Breakdown:
• Timeframe: 30 days | Key Metrics: Repeat usage rate, conversation depth | What Success Looks Like: 50%+ return within 7 days, 5+ exchanges per session
• Timeframe: 60 days | Key Metrics: Direct report improvement, behavior frequency | What Success Looks Like: 60%+ positive responses on pulse surveys
• Timeframe: 90 days | Key Metrics: Manager NPS lift, retention impact | What Success Looks Like: 10–15 point NPS increase, measurable attrition gap vs. control group
Proving ROI requires connecting coaching metrics to outcomes your CFO and CEO already care about: retention costs, productivity gains, and leadership pipeline strength. Start with the business problem you're solving.
Calculate retention ROI by comparing regrettable attrition rates for teams with coached managers versus those without. Multiply the difference by your average cost of turnover (typically 1.5–2x annual salary for knowledge workers).
Here's how to build this calculation with your data:
• Measure baseline regrettable attrition rate for your manager population
• Track attrition for coached managers after 6 months
• Calculate the percentage point difference
• Multiply by (number of direct reports × average salary × 1.5)
Example: If you have 100 managers with 10 direct reports each, baseline attrition of 15%, and coached manager attrition of 12%, that's a 3-percentage-point improvement. At $100,000 average salary: 1,000 employees × 3% × $100,000 × 1.5 = $450,000 annual savings. Your numbers will differ—use your actual attrition rates and turnover costs.
Calculate productivity ROI by measuring time saved on performance management, 1:1 preparation, and HR escalations. Survey managers quarterly on hours saved. Multiply by loaded cost (salary + benefits + overhead, typically 1.3–1.5x base salary).
Calculate leadership pipeline ROI by measuring promotion readiness rates and time-to-competency for new managers. If AI coaching reduces new manager ramp time, you gain months of full productivity per new manager. Track this through promotion readiness ratings in your talent review process.
Present these calculations alongside behavioral change metrics to show the full story: adoption proves engagement, behavior change proves skill development, and business outcomes prove financial return. Acknowledge attribution challenges openly—use control groups and baseline comparisons to strengthen your case, but recognize that isolating AI coaching's impact from other initiatives requires methodological rigor.
Tracking vanity metrics. Weekly active users mean nothing if managers aren't applying what they learn. High satisfaction scores don't predict behavior change. Platform engagement time doesn't correlate with business outcomes. Focus on behavior frequency and direct report feedback.
Measuring too early or too late. Expecting business outcomes at 30 days sets unrealistic expectations. Waiting 12 months to measure anything means you can't course-correct. Follow the 30-60-90 day timeline to track leading indicators, behavioral changes, and business outcomes in sequence.
Failing to establish baselines. Measure manager effectiveness, retention rates, and performance review quality before deploying AI coaching. Without baseline data, you can't demonstrate improvement. Collect at least 3 months of baseline data if possible.
Ignoring qualitative feedback. Quantitative metrics show what's happening. Qualitative feedback from managers and direct reports explains why. Combine pulse surveys with focus groups and direct report interviews.
Measuring in isolation. Identify comparable teams not using AI coaching at launch and track the same metrics. The difference between coached and non-coached groups provides stronger evidence than coached-group-only data. Control groups help address the attribution problem—you can't prove causation, but you can build a compelling case.
Assuming correlation equals causation. AI coaching doesn't happen in a vacuum. Other initiatives, seasonal trends, and regression to the mean all affect your metrics. Use control groups, track confounding variables, and present your findings with appropriate caveats. A 3-percentage-point attrition reduction among coached managers versus control groups is evidence, not proof.
• Effective AI coaching measurement requires tracking three layers: adoption signals (weeks 1–4), behavioral changes (weeks 4–12), and business outcomes (weeks 8–16)
• Traditional L&D metrics like completion rates don't capture AI coaching value—focus on behavior frequency and direct report improvement
• Prove ROI by connecting coaching metrics to outcomes executives care about: retention costs, productivity gains, and leadership pipeline strength
• Establish baselines and control groups before implementation to demonstrate impact and address attribution challenges
• Avoid vanity metrics—track whether managers apply coached behaviors in their daily work
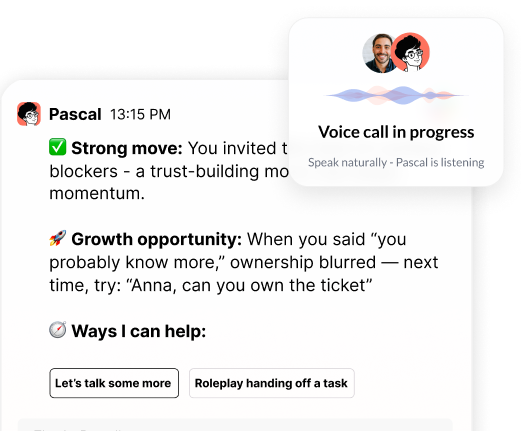
Ready to see how this measurement framework works in practice? Pascal tracks adoption signals, behavioral changes, and business outcomes automatically. See how Pascal works to understand how context-aware coaching inside Slack drives the behavioral changes that matter most to your organization.
Header photo by Zulfugar Karimov on Unsplash

.png)
.webp)
“Thank you for setting the great foundation for my promotion; now I have a plan!"

Curious to see how AI Coaching can 10X the impact and scale of your development initiatives. Book a demo today for: