

Proving AI coaching effectiveness requires tracking three distinct measurement levels: adoption patterns that predict sustained engagement, behavioral changes that show real skill development, and business outcomes that justify continued investment. The measurement framework must connect individual development to organizational impact.
Proving AI coaching effectiveness means demonstrating measurable behavior change that drives business outcomes, not just tracking usage statistics. Real proof shows managers applying new skills consistently, direct reports noticing improvement, and organizational metrics shifting positively.
Adoption patterns predict sustained engagement: repeat usage frequency, conversation depth, proactive versus reactive interactions, and time-to-value metrics. These signals tell you whether managers are building habits or just checking boxes.
Behavioral changes show real skill development: manager effectiveness scores, direct report feedback improvement, specific competency development in delegation and feedback quality, and application of learned behaviors in actual work situations. These measures provide insight beyond traditional surveys.
Business outcomes justify continued investment: retention rates for managers and their teams, promotion readiness, performance review quality, and team productivity metrics.
Data Breakdown:
• Vanity Metrics: Weekly active users | Leading Indicators: Repeat usage patterns | Business Outcomes: Retention rate improvement
• Vanity Metrics: Satisfaction scores | Leading Indicators: Conversation depth | Business Outcomes: Manager NPS lift
• Vanity Metrics: Login frequency | Leading Indicators: Proactive engagement | Business Outcomes: Promotion readiness
• Vanity Metrics: Feature adoption | Leading Indicators: Time-to-value | Business Outcomes: Performance review quality
• Vanity Metrics: Course completions | Leading Indicators: Skill application frequency | Business Outcomes: Team productivity gains
Start by establishing baseline metrics across three measurement levels before launch, then track weekly adoption signals, monthly behavioral indicators, and quarterly business outcomes. This phased approach delivers proof points to stakeholders at each stage while building toward comprehensive ROI demonstration.
Capture current manager effectiveness scores through direct report surveys or existing engagement data. Document current manager Net Promoter Score (a metric calculated by asking direct reports "How likely are you to recommend your manager to others?" on a 0-10 scale, then subtracting the percentage of detractors from promoters). Establish baseline retention rates for managers and their teams.
Identify 3-5 specific behavioral competencies your organization needs to develop: delegation, feedback quality, or difficult conversations. Set clear success criteria with your executive team. What improvement percentage justifies continued investment?
Monitor weekly active usage, but focus on repeat usage patterns. Track conversation depth: Are managers having substantive coaching conversations or just checking boxes?
Measure proactive versus reactive engagement: Is the AI coach embedded in workflow or only accessed during crises? Identify power users and non-adopters early to understand what drives sustained engagement.
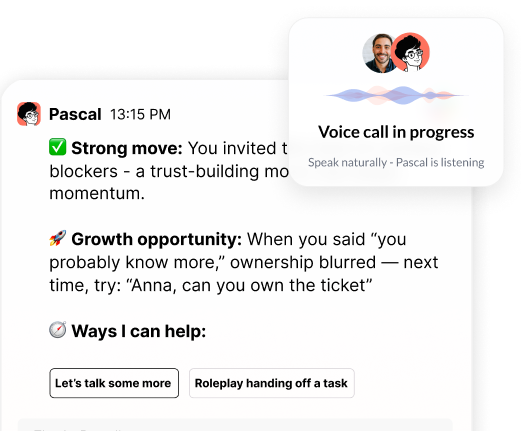
Tools embedded in existing platforms (Slack, Teams, Zoom) create natural adoption by meeting managers where they already work, driving higher engagement than standalone portals. The difference between embedded and bolt-on solutions shows up immediately in these adoption metrics.
Conduct pulse surveys with direct reports: "Has your manager's [specific skill] improved in the past 60 days?" Review coaching session summaries for evidence of skill application. Track manager self-reported confidence in handling specific situations like difficult conversations, performance reviews, and delegation.
Compare performance review quality scores before and after coaching intervention. Tools that can observe behavior as it happens provide insight beyond the surveys and anecdotal feedback that HR leaders have traditionally relied on.
Track manager Net Promoter Score, direct report improvement ratings, retention rates for coached managers and their teams, and time saved on manager support as your core ROI metrics. These four measures connect individual development to business outcomes that CFOs and CEOs understand.
Manager Net Promoter Score: Survey direct reports quarterly: "How likely are you to recommend your manager to others?" This metric directly correlates with team engagement and retention.
Direct Report Improvement Rating: Ask direct reports: "Has your manager improved in [specific competency] over the past 90 days?" This metric proves behavior change is visible and meaningful to the people who experience it daily.
Retention differential: Compare voluntary turnover rates for teams with coached managers versus uncoached managers. Even a 2-3 percentage point improvement justifies significant investment. Calculate the cost of replacing employees to translate retention gains into dollar impact.
Manager support time saved: Calculate hours your HR business partners and senior leaders spend coaching managers on routine situations. Multiply saved hours by fully-loaded hourly rates to quantify efficiency gains.
Promotion readiness acceleration: Track time-to-promotion for managers using AI coaching versus traditional development paths. Faster leadership pipeline development reduces external hiring costs and improves succession planning.
Performance review quality scores: Have senior leaders rate the quality of performance reviews before and after coaching intervention. Improved review quality correlates with better goal-setting, clearer expectations, and stronger performance management.
The biggest mistake is tracking engagement metrics instead of behavior change and business outcomes. Weekly active users and satisfaction scores tell you nothing about whether managers are actually improving. Organizations that focus on vanity metrics struggle to justify renewal when finance leaders ask for proof of impact.
Another critical error: measuring too late. Waiting until annual performance reviews to assess coaching impact means you've lost 12 months of optimization opportunity. Build measurement into your deployment from day one with weekly adoption checks, monthly behavioral pulses, and quarterly outcome reviews.
Many CHROs fail to establish clear baselines before launch. Without pre-coaching manager effectiveness scores, retention rates, and performance metrics, you cannot prove improvement. Capture baseline data during your pilot phase, even if it delays full rollout by a few weeks.
Organizations often measure in isolation rather than connecting coaching metrics to broader business outcomes. Link manager development directly to team retention, productivity, and engagement. Show the CFO how improvements in manager effectiveness correlate with reduced turnover costs.
Finance leaders need three things: clear cost comparison, measurable behavior change, and business outcome correlation. Present behavioral evidence within 90 days. Show direct report improvement ratings, manager effectiveness score increases, and specific examples of skill application captured in real work situations.
Connect coaching investment to retention ROI. If coached managers retain their teams at 3 percentage points higher than uncoached managers, calculate the cost savings. For a 1,000-person organization with $50,000 average salary and 3x replacement costs, a 3% retention improvement saves $4.5 million annually.
Clear-eyed assessment of where AI adds value and where human expertise remains irreplaceable helps build credibility with finance stakeholders. Don't oversell—acknowledge AI coaching's limitations while demonstrating its measurable strengths.
Track three measurement levels: adoption patterns (repeat usage, conversation depth), behavioral changes (direct report improvement, skill application), and business outcomes (retention, manager NPS, promotion readiness). Establish baselines before launch by capturing current manager effectiveness scores, retention rates, and performance metrics. Measure early and often with weekly adoption checks, monthly behavioral pulses, and quarterly outcome reviews. Focus on behavior change, not engagement—track direct report improvement ratings and observed skill application. Connect coaching to business outcomes by showing CFOs how manager development drives retention, reduces HR support time, and accelerates leadership pipeline development.
Pascal tracks adoption, behavioral changes, and business outcomes by observing how managers lead in meetings and workplace communications. See how Pascal works inside Slack, Teams, and Zoom to deliver measurable manager development at scale.
Header photo by Bluestonex on Unsplash

.png)
.webp)
“Thank you for setting the great foundation for my promotion; now I have a plan!"

Curious to see how AI Coaching can 10X the impact and scale of your development initiatives. Book a demo today for: