

Leadership coaching ROI is measured through three levels: adoption metrics that predict sustained use, behavioral change indicators that show skill application, and business outcomes like retention and team performance. AI coaching platforms can track these metrics in real time because they observe manager behaviors during actual work (meetings, emails, Slack conversations) rather than relying on quarterly surveys.
Traditional coaching creates a measurement gap. Sessions happen behind closed doors. Behavior change unfolds over months. Attributing business outcomes to specific interventions requires guesswork.
According to Gartner, only 12% of organizations can measure the business impact of their learning programs (https://www.gartner.com/en/human-resources/trends/top-priorities-for-hr-leaders). The problem isn't that coaching doesn't work—it's that proving it does requires data most organizations can't capture.
Human coaching lacks observable data points. Surveys capture perception, not performance shifts. When multiple development initiatives run at once, attribution becomes impossible.
AI coaching platforms change this by making behavior visible. They join meetings, analyze interactions, and track whether managers apply learned skills. As Jeff Diana, former CHRO at Calendly and Atlassian, notes: "So much of the real learning and value that comes from this comes from in-context coaching in the moment to drive performance and to solve problems in the moment."
Measuring ROI requires tracking three distinct levels. Organizations that focus on these three layers see clear proof of value within 90 days.
Level 1: Adoption Leading Indicators
These metrics predict whether your coaching investment will deliver sustained value. Active usage rate measures the percentage of managers engaging weekly—target 60% or higher. Session depth tracks average interaction length and follow-through on coaching recommendations. Integration touchpoints measure coaching moments embedded in workflow (meetings, Slack, email) rather than requiring separate logins.
80% of managers logging in weekly means nothing if they don't apply what they learn. Adoption metrics only predict ROI when paired with depth indicators.
Level 2: Behavioral Change Metrics
These show whether managers are developing new skills. Skill application frequency tracks how often managers demonstrate target behaviors (delegation, feedback delivery, 1-on-1 quality). Behavior consistency measures whether new skills persist beyond initial coaching interventions. Direct report perception uses 360-degree feedback showing team members notice improvement. Coaching velocity calculates time from skill introduction to consistent application.
Level 3: Business Outcomes
These justify continued investment to CFOs. Manager retention tracks reduction in manager turnover. Team performance measures productivity gains, goal attainment rates, and project delivery metrics. Employee engagement captures Manager Net Promoter Score increases. Time savings quantifies hours recovered from inefficient meetings, rework, and conflict resolution. Cost displacement calculates traditional coaching costs avoided.
Data Breakdown:
• Metric Level: Adoption | What It Measures: Will it stick? | Target Timeline: 0-30 days | Example KPI: 60%+ weekly active managers
• Metric Level: Behavioral | What It Measures: Are skills improving? | Target Timeline: 30-90 days | Example KPI: Direct reports notice improvement
• Metric Level: Business | What It Measures: Does it drive results? | Target Timeline: 90-180 days | Example KPI: Manager NPS increase
The difference is measurement capability. AI coaching generates observable data at every interaction. Traditional methods rely on post-program surveys and manager assessments.
Traditional Human Coaching:
Cost runs $3,000-$15,000 per executive annually. Scalability limits coverage to senior leaders (top 5% of organization). Measurement relies on self-reported improvements and quarterly check-ins. Time to impact stretches 6-12 months for sustained behavior change. Data visibility remains minimal—sessions are confidential, outcomes are anecdotal.
Learning Management Systems:
Cost averages $50-150 per employee annually. Scalability is unlimited, but engagement averages 15-20%. Measurement tracks completion rates and quiz scores. Time to impact remains unclear—most content is never applied. Josh Bersin research shows most L&D spending goes to tools with minimal usage (https://joshbersin.com/2023/07/the-big-reset-in-learning-and-development/).
Traditional Training Programs:
Cost ranges $1,000-3,000 per participant per program. Scalability requires cohort-based scheduling. Measurement uses post-training surveys and knowledge assessments. Time to impact takes 3-6 months if reinforced, often forgotten within weeks. Data visibility includes pre/post assessments, but no application tracking.
AI Coaching Platforms:
Cost runs a fraction of traditional coaching expenses. Scalability covers every manager in the organization. Measurement tracks real-time behavior application, skill development velocity, and direct report feedback. Time to impact shows measurable change within 30-60 days. Data visibility provides observation of manager behaviors in actual work contexts.
The first 90 days determine whether your coaching investment survives its first renewal. Track these metrics weekly to catch problems early and demonstrate value fast.
Weeks 0-30: Adoption Signals
Weekly active managers should hit 60% or higher by week four. Average sessions per manager should reach 3-5 weekly interactions. Integration depth measures coaching moments happening inside workflow tools. Time to first value tracks days from onboarding to first meaningful coaching interaction—target under 7 days.
Weeks 30-60: Behavior Indicators
Skill application frequency counts how often managers demonstrate coached behaviors in observed interactions. Coaching follow-through measures whether managers complete recommended actions between sessions. Direct report feedback captures whether team members notice changes—even small improvements signal momentum. Behavior persistence tracks whether new skills continue beyond initial coaching interventions.
Weeks 60-90: Early Business Impact
Manager confidence scores from self-assessments show whether managers feel more capable. Team engagement pulse from quick surveys reveals whether direct reports notice improvements. Time savings from meeting efficiency and reduced rework become quantifiable. Early retention signals track whether at-risk managers show stabilization.
Financial ROI calculation requires connecting coaching investments to tangible cost savings and revenue impact. Start with three core formulas that CFOs understand.
Cost Avoidance:
Calculate what you're not spending. Traditional executive coaching costs $10,000 per person annually. If you choose an AI coaching platform at $100 per person annually for 100 managers, you avoid $990,000 in traditional coaching costs. Add unused LMS licenses ($50-150 per employee) and low-engagement training programs ($1,000-3,000 per participant).
Retention Savings:
Manager turnover costs 100-150% of annual salary (recruiting, onboarding, lost productivity). If your coaching program reduces manager turnover and average manager salary is $120,000, each prevented departure saves $150,000. For an organization with 100 managers and 20% baseline turnover, preventing even 2-3 departures creates measurable savings.
Productivity Gains:
Track hours recovered through more efficient meetings, faster decision-making, and reduced conflict resolution time. At $75/hour average manager cost, recovered productivity per manager becomes quantifiable.
Total ROI Formula:
(Cost Avoidance + Retention Savings + Productivity Gains - Implementation Cost) / Implementation Cost = ROI%
This calculation excludes harder-to-quantify benefits like improved team performance, faster promotion readiness, and reduced HR business partner workload. Use conservative estimates and document your assumptions. CFOs trust ranges more than precise percentages.
AI coaching platforms should provide five data layers that traditional approaches can't deliver. Demand these capabilities during vendor evaluation.
Adoption Analytics:
Weekly active users, session frequency, interaction depth, proactive engagement ratios, integration touchpoints across tools, time to first value, and cohort comparisons showing which teams engage most.
Skill Development Metrics:
Behavior frequency tracking across specific competencies, skill application consistency over time, coaching velocity showing time from introduction to mastery, direct report perception through integrated 360 feedback, and personalized development pathways showing individual progress.
Organizational Insights:
Aggregated trends (protecting individual privacy), common challenges surfaced across manager cohorts, skill gaps identified for targeted interventions, culture indicators showing alignment with company values, and real-time pulse replacing quarterly engagement surveys.
Business Impact Data:
Manager retention rates, team performance metrics, employee engagement scores, productivity indicators, and cost avoidance calculations. These connect coaching activities to business outcomes CFOs care about.
Predictive Indicators:
Early warning signals for at-risk managers, promotion readiness assessments, succession planning insights, and intervention effectiveness showing which coaching approaches work best for different manager profiles.
Organizations that demand this level of data visibility during vendor selection avoid the measurement gap that plagued traditional coaching approaches.
• Three-level measurement framework: Track adoption leading indicators (0-30 days), behavioral change metrics (30-90 days), and business outcomes (90-180 days) rather than relying on engagement metrics alone.
• AI coaching shows faster skill development: Platforms that observe managers during actual work show measurable behavior change within 90 days (traditional approaches require 6-12 months).
• Direct report feedback validates improvement: The most credible metric is whether team members notice and report manager behavior changes.
• Financial ROI combines three factors: Calculate cost avoidance from traditional coaching, retention savings from reduced manager turnover, and productivity gains from time savings. Use conservative estimates and document assumptions.
• Demand five data layers: Adoption analytics, skill development metrics, organizational insights, business impact data, and predictive indicators separate platforms built for measurement from generic AI tools.
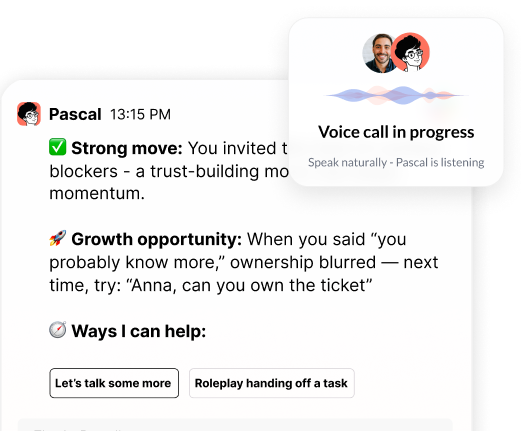
Pascal by Pinnacle joins your managers' meetings, delivers real-time coaching, and tracks the behavioral changes that drive business outcomes.
See how Pascal works inside Slack, Teams, and meetings to deliver coaching ROI you can prove to your CFO.
Header photo by Christina @ wocintechchat.com M on Unsplash

.png)
.webp)
“Thank you for setting the great foundation for my promotion; now I have a plan!"

Curious to see how AI Coaching can 10X the impact and scale of your development initiatives. Book a demo today for: