

Track three measurement levels: adoption patterns, behavioral change, and business outcomes. Establish baselines before implementation, measure at 30, 60, and 90 days, and use control groups to isolate coaching impact from other variables.
AI coaching refers to software platforms that provide on-demand management guidance through conversational interfaces (typically integrated into Slack, Teams, or Zoom). These platforms use AI to deliver personalized coaching on topics like delegation, feedback, and conflict resolution.
Measure AI coaching impact through three interconnected levels: adoption metrics (weekly active users, conversation depth), behavioral change (direct report feedback, manager effectiveness scores), and business outcomes (retention rates, time-to-productivity). Each level requires different measurement windows—adoption shows up in 30 days, behavioral change in 60-90 days, and business outcomes in 90-180 days.
Adoption metrics track whether managers engage consistently. Monitor weekly active users, average session length, topics explored, and repeat usage rate. These signals show whether the platform fits into daily workflows.
Strong adoption indicators include managers returning to the platform multiple times per week, exploring diverse topics beyond their initial concerns, and increasing session depth over time. A manager might start with basic questions about delegation but progress to complex scenarios involving conflict resolution and performance management within their first month.
Behavioral change requires direct report feedback collected through pulse surveys (brief monthly surveys with 3-5 questions), 360 assessments, and manager effectiveness scores measured before and after implementation. The most reliable metric: "Has your manager improved in [specific skill area] over the past 90 days?" tracked longitudinally.
This level of measurement reveals whether AI coaching translates into observable changes in management practice. A manager might complete dozens of coaching sessions, but if their direct reports notice no improvement in communication, delegation, or feedback quality, the coaching has failed to create real impact.
Effective behavioral measurement focuses on specific, observable competencies. Instead of asking "Are you satisfied with your manager?" ask "Has your manager provided more actionable feedback in the past 30 days?" or "Has your manager improved at delegating appropriate responsibilities?"
Track Manager Net Promoter Score (mNPS): "How likely are you to recommend this manager to a colleague?" on a 0-10 scale. This single question provides a benchmark for manager effectiveness that you can track over time.
Business outcomes manifest in retention improvements (especially among first-year managers and their direct reports), productivity gains (time-to-competency for new managers, decision-making speed), and promotion readiness (internal mobility rates, leadership pipeline strength).
These outcomes typically appear 90-180 days after implementation and represent the ultimate validation of AI coaching effectiveness.
Link adoption to behavior: managers using AI coaching three or more times weekly show higher skill application rates. Link behavior to outcomes: teams with managers showing behavioral improvement have lower turnover and faster time-to-productivity.
Establish baselines for manager effectiveness scores, direct report satisfaction, team retention rates, time-to-productivity for new managers, and promotion success rates. Without these baselines, you cannot prove AI coaching caused any improvements you observe.
Collect demographic and contextual data for matching control groups: years of management experience, team size, department, geographic location, and baseline performance ratings. This data enables rigorous comparison between coached and non-coached cohorts.
Document current training investments and outcomes. How much does your organization spend on external coaching, management training programs, and leadership development? What outcomes do these investments currently deliver? This baseline establishes the benchmark AI coaching must exceed to justify adoption.
Track weekly active usage, conversation depth (number of exchanges per session), topic diversity (number of distinct areas explored), and early behavioral change signals from pulse surveys. These leading indicators predict whether your implementation will succeed or whether you need to adjust your approach.
Monitor adoption patterns across different manager segments. Do first-time managers engage differently than experienced leaders? Do certain departments show higher adoption rates? These patterns reveal where AI coaching delivers the most value and where additional support or customization might be needed.
Collect qualitative feedback from managers about their coaching experience. What topics do they find most valuable? Where does the coaching fall short? This feedback enables rapid iteration and improvement during the first 90 days.
Combine quantitative scores with qualitative feedback. Ask direct reports to provide specific examples of behavior change: "What has your manager done differently in the past 30 days?" These examples validate the quantitative scores and surface unexpected improvements the surveys might miss.
Measure the same metrics you established at baseline: manager effectiveness scores, direct report satisfaction, team retention rates, time-to-productivity, and promotion success rates. Compare coached cohorts to control groups receiving traditional training.
Use matched cohorts to isolate AI coaching impact. Match managers on these variables: team size, years of management experience, department, and baseline performance scores. One group receives AI coaching, the control group receives traditional training. Measure both groups over 90-180 days using identical instruments.
Without control groups, you're measuring correlation, not causation. Manager improvement might result from economic conditions, company growth, or other training initiatives running simultaneously.
Random assignment provides the gold standard for causal inference, but organizational realities often require quasi-experimental designs. When random assignment isn't feasible, create statistically equivalent groups based on observable characteristics.
Consider these matching variables beyond the basics:
• Baseline manager effectiveness scores (within 0.3 points on a 5-point scale)
• Team size (within 2-3 people)
• Years of management experience (within 1-2 years)
• Department or function (exact match when possible)
• Geographic location (to control for regional economic factors)
Ensure both groups receive some form of development support. The control group might receive traditional training, access to written resources, or periodic workshops. This design tests whether AI coaching outperforms existing alternatives rather than comparing coaching to nothing.
Plan for adequate sample sizes. A study comparing 20 coached managers to 20 control managers lacks statistical power to detect meaningful differences. Aim for at least 50 managers per group.
Account for attrition. Some managers will leave the organization, change roles, or stop participating during the measurement period. Plan for 10-15% attrition and recruit accordingly.
Adoption signals appear within 30 days, behavioral changes within 60-90 days, and business outcomes within 90-180 days.
Data Breakdown:
• Measurement Level: Adoption | Timeline: 0-30 days | Key Metrics: Weekly active users, session length, topics explored | What to Look For: Managers returning multiple times per week, exploring diverse topics
• Measurement Level: Behavioral Change | Timeline: 60-90 days | Key Metrics: 360 scores, pulse surveys, mNPS | What to Look For: Direct reports notice specific improvements in management practice
• Measurement Level: Business Outcomes | Timeline: 90-180 days | Key Metrics: Retention rates, time-to-productivity, promotion readiness | What to Look For: Measurable differences between coached and control groups
Behavioral change takes time. Managers need repeated practice applying new skills in real situations before those skills become habits. Traditional management training might require 6-12 months to show measurable behavioral change, while AI coaching with its on-demand support and repeated practice opportunities can compress this timeline to 60-90 days. Expecting results in 30 days sets unrealistic expectations and may lead to premature abandonment of effective programs.
Business outcomes manifest in three primary areas within 90-180 days: retention improvements, productivity gains, and promotion readiness. Track retention for teams led by managers using AI coaching versus control groups.
Retention metrics include 90-day new hire retention, first-year manager retention, and voluntary turnover on coached managers' teams. These metrics reveal whether improved management keeps people at the company.
Focus on retention among high performers and critical roles. A 5% overall improvement in retention matters less if your top performers still leave at the same rate. Segment retention data by performance level, tenure, and role criticality to understand where AI coaching delivers the most value.
Calculate the financial impact of retention improvements. If AI coaching reduces voluntary turnover among coached managers' teams from 15% to 12%, and the average replacement cost is $75,000 per employee, a company with 100 managers (each leading teams of 8 people) saves approximately $1.8 million annually.
Measure time-to-productivity for newly promoted managers. How quickly do first-time managers reach full effectiveness? Traditional timelines might span 6-12 months, while managers receiving AI coaching might reach competency in 4-8 months.
Track decision-making cycle time for routine management decisions. Do coached managers resolve performance issues, approve requests, or make resource allocation decisions faster than their peers? Faster decision-making reduces bottlenecks and improves team productivity.
Monitor meeting effectiveness scores. Ask team members: "Our team meetings are productive and well-run" on a 5-point scale. Improved meeting effectiveness saves time and increases team satisfaction.
Track time-to-first-promotion for coached managers. Do managers receiving AI coaching advance to senior leadership roles faster than their peers? This metric reveals whether coaching accelerates leadership development and strengthens the internal pipeline.
Measure internal mobility rates. What percentage of coached managers successfully transition to new roles within the organization? Higher mobility indicates broader skill development and organizational confidence in coached managers' capabilities.
Cost avoidance represents another outcome. Calculate the reduction in external coaching spend (executive coaching costs $300-500 per hour), decreased need for HR business partners to support struggling managers, and lower turnover replacement costs.
A company spending $200,000 annually on external coaching for 20 senior managers might reduce this spend by 60% while expanding coaching access to 200 managers through AI coaching, dramatically improving both cost efficiency and program reach.
Conversation depth and topic diversity predict sustained coaching impact better than raw usage numbers. Track the number of exchanges per coaching session (three or more indicates depth) and the number of distinct topics explored in the first 30 days (five or more indicates breadth).
Track the ratio of proactive coaching to reactive coaching. Proactive coaching happens before meetings or decisions. Reactive coaching happens after crises or mistakes. A higher proactive ratio correlates with sustained behavior change.
Managers who seek coaching before difficult conversations, performance reviews, or strategic decisions demonstrate integration of coaching into their management practice. This proactive pattern predicts long-term effectiveness better than total session counts.
Avoid vanity metrics: total logins, time spent in platform, and completion rates without application tracking. These tell you nothing about whether managers improved. A manager could log in daily and never apply a single insight.
Track the "coaching to action" ratio: how many coaching conversations lead to documented behavior changes? This metric reveals whether your AI coaching platform provides actionable guidance or generic advice.
Monitor the time between coaching sessions and application. Managers who implement coaching insights within 24-48 hours show higher skill retention and behavioral change than those who delay application. This pattern suggests the coaching provides relevant, timely guidance.
Identify early warning signals that predict low impact:
• Declining session frequency after initial adoption (week 2-4 drop-off)
• Repetitive questions about the same topic without progression
• Short sessions with minimal back-and-forth dialogue
• Coaching sessions clustered around crises rather than distributed throughout the week
• Low topic diversity (managers exploring only 1-2 areas)
These patterns indicate managers aren't integrating coaching into their practice or the platform isn't meeting their needs. Early intervention—additional training, manager outreach, or platform adjustments—can salvage implementations showing these warning signs.
• Track three measurement levels: Adoption patterns show up in 30 days, behavioral changes appear in 60-90 days, and business outcomes manifest in 90-180 days.
• Establish baselines and control groups: Without pre-coaching data and matched cohorts, you cannot prove AI coaching caused the improvements you observe.
• Behavioral change requires direct report feedback: Use pre/post 360 assessments, monthly pulse surveys, and Manager Net Promoter Scores to measure whether managers improved.
• Conversation depth predicts success: Track exchanges per session (three or more) and topics explored in the first 30 days (five or more) to identify managers likely to sustain behavior change.
• Compare coached cohorts to control groups: Match managers on team size, experience, department, and baseline performance. Measure both groups over 90-180 days using identical instruments.
• Focus on business outcomes, not vanity metrics: Retention improvements, productivity gains, and promotion readiness demonstrate ROI better than login counts or time spent in platform.
• Collect qualitative feedback alongside quantitative data: Specific examples of behavior change validate scores and reveal unexpected improvements.
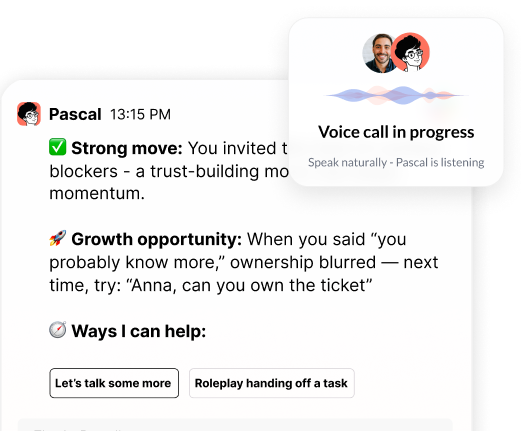
See how Pascal works inside Slack at https://www.heypinnacle.com/ to deliver real-time coaching that scales to every manager in your organization.
Header photo by Christina @ wocintechchat.com M on Unsplash

.png)
.webp)
“Thank you for setting the great foundation for my promotion; now I have a plan!"

Curious to see how AI Coaching can 10X the impact and scale of your development initiatives. Book a demo today for: