

Measuring AI coaching impact requires tracking three layers: adoption patterns (who uses it and how often), behavioral changes (what managers do differently), and business outcomes (retention and performance improvements). Unlike traditional training programs measured through quarterly surveys, continuous coaching requires continuous measurement.
AI coaching measurement operates on three timelines. Adoption signals appear within 30 days, behavioral changes within 60-90 days, and business outcomes within 90-180 days.
Data Breakdown:
• Measurement Layer: Layer 1: Adoption Signals | Timeline: Days 1-30 | Key Metrics: Active user rate, conversation depth, repeat usage, feature utilization | Success Indicators: 60%+ managers engage at least once; 30%+ return for multiple sessions
• Measurement Layer: Layer 2: Behavioral Changes | Timeline: Days 30-90 | Key Metrics: Manager effectiveness scores, 360-degree feedback, skill application rates | Success Indicators: 10-15% improvement in manager effectiveness scores among active users
• Measurement Layer: Layer 3: Business Outcomes | Timeline: Days 90-180+ | Key Metrics: Voluntary turnover rates, performance ratings, time-to-productivity, engagement scores | Success Indicators: 3+ percentage point reduction in attrition; measurable performance improvements
Layer 1 tracks whether managers use the tool. Active user rate measures weekly usage percentage. Conversation depth captures average exchanges per session. Repeat usage shows managers returning multiple times. Feature utilization reveals which coaching capabilities get used most.
Layer 2 measures whether coaching changes leadership behavior. Manager effectiveness scores from direct reports show perceived improvement. 360-degree feedback tracks specific competency development. Skill application rates measure managers using learned frameworks in real situations.
Layer 3 connects coaching to financial results. Voluntary turnover rates for teams with coached managers versus control groups quantify retention impact. Performance rating distributions show teams exceeding goals. Time-to-productivity for new managers measures acceleration. Employee engagement scores correlated with manager coaching usage demonstrate team health.
Cost avoidance from retention improvements provides the clearest ROI metric. Calculate financial impact by identifying replacement cost per employee, multiplying by prevented departures, and comparing against coaching investment.
The calculation:
• Establish baseline turnover rates for teams with and without coaching access. Track voluntary departures among high performers.
• Calculate replacement costs including recruiting, onboarding, lost productivity, and knowledge transfer. For a knowledge worker earning $100K, replacement costs run $150-200K.
• Measure prevented departures. A 3 percentage point attrition reduction in a 500-person organization equals 15 prevented departures annually.
• Calculate total savings. 15 prevented departures × $175K average replacement cost = $2.6M in cost avoidance.
• Compare to investment. A $300K annual coaching program delivers 8.7x ROI.
This calculation assumes coaching caused the entire attrition reduction. In practice, market conditions, compensation changes, and other HR initiatives also affect turnover. Track exit interview themes to identify whether manager effectiveness issues decreased. Compare coached teams to control groups to isolate coaching impact.
Behavioral metrics focus on observable leadership actions rather than self-reported confidence. The most predictive metrics: delegation frequency, feedback quality, 1:1 consistency, and decision-making speed.
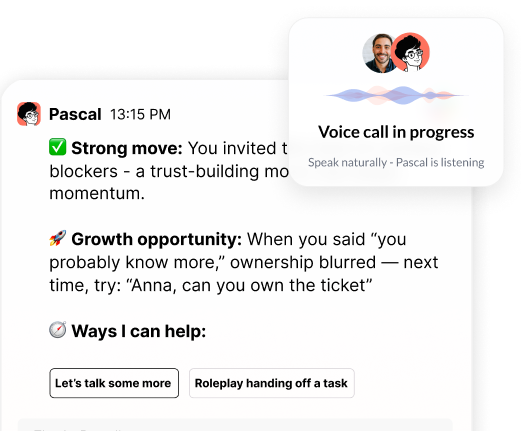
Delegation patterns measure frequency and quality of task assignments. Track how often managers delegate, to whom, and whether they provide context and authority with the task. At Pascal, we analyze meeting transcripts to identify delegation moments and score them on clarity and empowerment.
Feedback delivery tracks the ratio of positive to constructive feedback, specificity, and timeliness. Vague praise ("good job") predicts worse outcomes than specific recognition ("your Q3 pipeline analysis helped us reprioritize resources").
1:1 meeting consistency captures cancellation rates, meeting duration, and conversation depth. Measure questions asked versus directives given. Managers who ask more questions lead higher-performing teams.
Decision-making speed measures time from problem identification to decision, stakeholder inclusion, and communication clarity. Faster decisions with clear communication correlate with higher team velocity.
Recognition frequency measures public acknowledgment of team wins, specificity of praise, and connection to company values. In our analysis of 200+ managers using Pascal, teams whose managers recognize specific contributions weekly show 18% higher engagement than teams receiving monthly recognition.
Organizations should expect improvements in adoption, learning speed, and early behavior change within 90 days. Full financial ROI materializes over 6-12 months.
The first 30 days reveal whether managers find value through usage patterns and repeat engagement. Look for 60%+ of managers engaging at least once and 30%+ returning for multiple sessions.
Days 30-60 show early behavioral changes as managers apply coaching guidance. Direct reports notice differences in communication style, feedback quality, and decision-making. Track manager effectiveness scores—expect 10-15% improvement among active users.
Days 60-90 deliver measurable improvements in manager effectiveness scores and early retention signals. Track voluntary turnover rates and compare teams with coached managers to control groups.
Organizations that see strong 90-day results share common implementation strategies: identify champions who share their successes, give early access to team members before full rollout, have senior leaders use and endorse the tool, and connect it to organizational rituals like quarterly check-ins and performance reviews.
Connecting behavior change to business outcomes requires integrating coaching platforms with HRIS systems. Track performance ratings over time and correlate them with observed behavioral changes. Pull scorecard and goal data from corporate systems to connect coaching interventions to business metrics.
Attribution is challenging. Pilot programs with built-in measurement frameworks provide clearer proof points. Compare teams with coached managers to control groups on voluntary turnover, performance ratings, engagement scores, and productivity measures.
Track leading indicators that predict lagging outcomes. Managers who consistently use coaching and show behavioral improvements in delegation, feedback, and decision-making lead teams with lower turnover and higher engagement. Establish baseline metrics before implementation, then measure at 90 days, 180 days, and 12 months.
At Pascal, we aggregate communication data to provide insights about team health, onboarding effectiveness, and succession planning. This continuous performance data provides more value than annual engagement surveys or performance reviews. (We analyze meeting transcripts and Slack conversations with manager consent, focusing on coaching moments rather than surveillance.)
• Three-layer measurement framework: Track adoption signals (30 days), behavioral changes (60-90 days), and business outcomes (90-180 days) rather than relying on usage statistics alone
• Cost avoidance calculation: Reducing turnover by 3 percentage points in a 500-person organization saves $1.5-2M annually in replacement costs, though attribution requires comparing coached teams to control groups
• Behavioral metrics predict performance: Delegation patterns, feedback quality, and 1:1 consistency correlate with team outcomes—measure observable actions, not self-reported confidence
• 90-day expectations: Focus on adoption and early behavior change, not full financial ROI, which materializes over 6-12 months
Pascal by Pinnacle provides the three-layer measurement framework that connects daily coaching interactions to business outcomes. The platform tracks behavioral patterns through meeting transcripts and communication data, providing quantitative scoring across adoption, behavior change, and business results. See how Pascal works inside Slack to deliver manager development with clear ROI tracking.
Header photo by Vitaly Gariev on Unsplash

.png)
.webp)
“Thank you for setting the great foundation for my promotion; now I have a plan!"

Curious to see how AI Coaching can 10X the impact and scale of your development initiatives. Book a demo today for: