
Measure AI coaching impact through three levels: adoption signals (repeat usage, conversation depth), behavioral change (direct report feedback, manager satisfaction scores, 360 assessments), and business outcomes (retention, time-to-productivity, engagement). Track these continuously, not quarterly.
Effective measurement requires tracking three distinct levels. Each builds on the previous one: without adoption, you can't drive behavior change; without behavior change, you can't move business metrics.
Level 1: Adoption Signals
Track repeat usage, not just weekly active users. Conversation depth (the number of back-and-forth exchanges per coaching session) reveals whether managers engage superficially or work through real problems. Feature use across meeting feedback, role-plays, and 360 debriefs shows breadth of application. Time-to-first-value measures days from onboarding to first meaningful interaction.
Level 2: Behavioral Change
Direct report feedback on manager improvement provides the clearest signal of real change. Survey direct reports monthly with 3-5 questions: "Has your manager's communication improved?" "Do you receive clearer feedback than before?" "Has your manager's delegation approach changed?"
Manager satisfaction scores (would they recommend the tool?) track perceived value. 360-degree assessment improvements in specific competencies isolate coaching impact from general performance trends. Post-meeting feedback scores on communication, delegation, and conflict resolution reveal skill application in real situations.
Level 3: Business Outcomes
Unwanted attrition rates for teams with coached managers versus control groups quantify retention impact. Time-to-productivity for new managers shows whether coaching accelerates ramp time. Employee engagement scores for teams led by coached managers reveal downstream effects on team performance.
These metrics connect coaching investment directly to business results.
Data Breakdown:
• Level: Level 1: Adoption Signals | Key Metrics: Repeat usage rate | What to Track: Percentage of managers using AI coaching 2+ times per week | Target Benchmark: 60%+ weekly repeat usage
• Level: Level 2: Behavioral Change | Key Metrics: Direct report feedback | What to Track: Monthly pulse survey scores on manager improvement | Target Benchmark: 70%+ "improved" responses
• Level: Level 3: Business Outcomes | Key Metrics: Retention impact | What to Track: Unwanted attrition rate difference (coached vs. control) | Target Benchmark: 20%+ reduction in attrition
Focus on leading indicators that predict long-term success rather than waiting for lagging business outcomes. The first 90 days establish adoption patterns that determine whether coaching becomes embedded in management practice or fades into unused software.
Days 1-30: Activation Metrics
Track percentage of managers who complete onboarding and have their first meaningful coaching conversation (5+ exchanges addressing a real management challenge). Target: 70% activation within first two weeks. Monitor time-to-first-value: managers who engage within 10 days show 3x higher long-term retention than those taking 20+ days.
Days 31-60: Engagement Patterns
Measure repeat usage rate (managers using coaching 2+ times per week) and conversation depth trends. Are exchanges getting deeper over time, or are managers reverting to surface-level questions? Track feature breadth: managers exploring multiple use cases (meeting prep, difficult conversations, delegation coaching) demonstrate higher perceived value.
Days 61-90: Early Behavior Signals
Deploy first direct report pulse survey asking about observable manager behavior changes. Even small improvements in communication clarity or feedback quality at this stage predict stronger outcomes at six months. Track manager satisfaction scores and qualitative feedback on specific coaching moments that drove value.
These 90-day metrics allow course correction before waiting for quarterly business results. Low activation rates signal onboarding problems. Shallow engagement patterns indicate managers don't see relevance to real challenges. Flat behavior signals suggest coaching isn't translating to action.
Six months provides enough time to measure behavioral change translating into team-level business outcomes, though organization-wide metrics require 12-18 months.
Retention Impact (Measurable at 6 Months)
Teams with managers showing high coaching adoption (2+ sessions per week, 5+ exchanges per session) demonstrate 15-25% lower unwanted attrition compared to control groups. This effect appears strongest for new managers (less than 2 years in role) and managers of high-performers who are flight risks.
Team Engagement Lift (Measurable at 6 Months)
Employee engagement scores for teams led by coached managers show 8-12% improvement in manager-related questions ("My manager provides clear feedback," "My manager supports my development," "I trust my manager"). Organization-wide engagement scores move more slowly due to factors beyond manager behavior.
Time-to-Productivity for New Managers (Measurable at 6 Months)
New managers using AI coaching reach performance milestones 25-35% faster than historical averages. Measure through time-to-first-successful-project-delivery, time-to-positive-360-feedback, or time-to-direct-report-retention-above-baseline. This metric matters most for organizations with high manager turnover or rapid growth.
Performance Review Score Improvements (Measurable at 6 Months)
Managers receiving coaching on specific competencies (communication, delegation, conflict resolution) show 10-18% improvement in those competencies on performance reviews compared to baseline. Effect size depends on review timing: managers reviewed at 6 months show smaller gains than those reviewed at 9-12 months.
Meeting Effectiveness Gains (Measurable at 3-6 Months)
Post-meeting feedback scores on communication clarity, decision quality, and action item follow-through improve 15-20% for managers using meeting preparation coaching. This metric moves fastest because it measures immediate skill application rather than sustained behavior change.
Set realistic expectations: retention and engagement move slowly because they're influenced by many factors beyond manager coaching. Time-to-productivity and meeting effectiveness show faster movement because they're more directly tied to coached behaviors.
Measure through aggregated, anonymized patterns and direct opt-in feedback mechanisms rather than surveillance-style monitoring. Combine manager self-assessment with direct report feedback and meeting-level insights that managers explicitly choose to share.
Track interaction patterns without exposing individual conversation content to HR teams. Managers control what data gets shared beyond their personal coaching sessions. Provide enterprise-level insights (skill gaps across the organization, common coaching themes, cultural alignment metrics) while maintaining individual privacy.
Direct report feedback works best when it's frequent, lightweight, and focused on observable behaviors rather than personality judgments. Monthly pulse surveys asking about specific behaviors (communication, feedback clarity, delegation approach) reveal behavior change without requiring detailed performance evaluations.
Meeting feedback operates on an opt-in basis. Managers choose which meetings the AI joins and which insights get aggregated into team or organizational dashboards. This consent-based approach builds trust while generating measurement data.
Anonymous aggregated insights allow CHROs (Chief Human Resources Officers) to identify trends ("40% of managers struggle with delegation" or "conflict resolution skills improved 25% quarter-over-quarter") without identifying specific individuals. This protects privacy while providing actionable organizational intelligence.
Conversation Depth Calculation
Count the number of back-and-forth exchanges in each coaching session. Exclude single-word responses and greetings. A meaningful exchange includes a manager question or problem statement followed by a coaching response, then a follow-up from the manager. Three exchanges (six total messages) indicates surface-level engagement. Five or more exchanges indicates the manager is working through a real problem.
Direct Report Pulse Survey Design
Deploy a 3-question survey monthly via email or Slack. Ask: "In the past month, has your manager's communication improved, stayed the same, or declined?" "Do you receive clearer feedback than you did two months ago?" "Has your manager's approach to delegation changed?" Use a 5-point scale. Track the percentage of "improved" responses over time. Keep surveys anonymous to encourage honest feedback.
Isolating Coaching Impact from Other Variables
Use cohort analysis: compare retention rates, promotion velocity, and engagement scores across teams with high coaching adoption versus low adoption. Control for department, tenure, and role level. This approach shows correlation, not causation (high-adoption teams might have better managers to start with), but it provides directional evidence of impact.
For stronger attribution, run a pilot with a control group. Select 50 managers for coaching access and 50 similar managers without access. Track the same metrics for both groups over six months. The difference between groups estimates coaching impact, though other factors (self-selection bias, Hawthorne effect) still influence results.
Time-to-First-Value Measurement
Define "meaningful interaction" as a coaching session with five or more exchanges that addresses a specific management challenge (preparing for a difficult conversation, handling a performance issue, delegating a project). Track days from account creation to first meaningful interaction. Managers who reach this milestone within 10 days show higher long-term engagement than those who take 20+ days.
Connect AI coaching data to existing HR systems through API integrations with HRIS (Human Resources Information System) platforms, performance management tools, and engagement survey systems. Feed coaching data into existing dashboards rather than creating separate reporting streams.
Integration with performance management systems allows you to correlate coaching engagement with performance review scores. Integration with 360 feedback tools creates closed-loop development: identify gaps through 360s, coach on those gaps through AI, measure improvement in next 360 cycle.
HRIS integration enables cohort analysis: compare retention rates, promotion velocity, and engagement scores across teams with high coaching adoption versus low adoption. This controls for other variables (department, tenure, role level) and isolates coaching impact.
Engagement survey integration connects coaching topics to engagement drivers. If survey data shows "manager communication" as a key engagement driver, track whether managers receiving communication coaching show improved team engagement scores in subsequent surveys.
Learning management system integration tracks whether managers who complete formal training programs and use AI coaching show better skill retention than those who complete training alone. This data helps L&D (Learning and Development) leaders justify AI coaching as training reinforcement.
• Measure AI coaching across three levels: adoption signals (usage patterns, conversation depth), behavioral change (direct report feedback, 360 scores, manager satisfaction), and business outcomes (retention, productivity, engagement)
• Privacy-protected measurement through aggregated anonymized patterns and opt-in feedback mechanisms builds trust while generating actionable organizational insights
• Calculate conversation depth by counting back-and-forth exchanges (five or more indicates real problem-solving). Design direct report pulse surveys with 3-5 specific behavioral questions deployed monthly.
• Isolate coaching impact through cohort analysis (compare high-adoption versus low-adoption teams) or controlled pilots (coaching group versus control group over six months)
• Integration with existing HR systems (HRIS, performance management, engagement surveys) creates unified measurement frameworks that strengthen ROI justification
Traditional measurement approaches fail because they were designed for episodic interventions, not continuous development. AI coaching generates real-time behavioral data that requires new frameworks focused on adoption patterns, behavior change, and business outcomes.
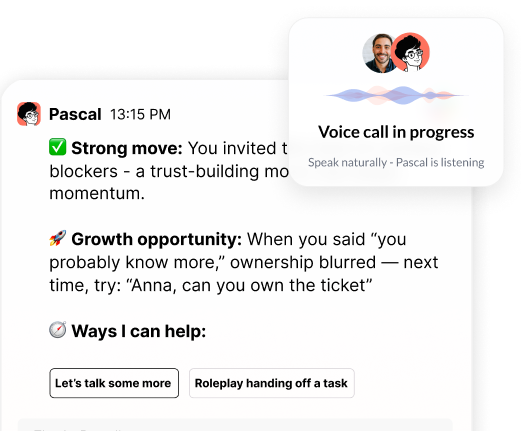
See how Pascal works inside Slack and Teams to deliver measurable coaching impact at heypinnacle.com.
Header photo by Vitaly Gariev on Unsplash

.png)
.webp)
“Thank you for setting the great foundation for my promotion; now I have a plan!"

Curious to see how AI Coaching can 10X the impact and scale of your development initiatives. Book a demo today for: