

Proving AI coaching effectiveness requires tracking three measurement levels: adoption patterns that predict sustained use, behavioral changes managers apply, and business outcomes like retention and team performance.
Full disclosure: This guide explains how to measure AI coaching platforms, with specific examples from Pascal (Pinnacle's AI coaching product). The measurement framework applies to any AI coaching tool, but we reference Pascal's approach where relevant.
Real AI coaching impact shows up in three distinct measurement levels: adoption leading indicators, behavioral change metrics, and business outcomes.
Adoption leading indicators measure repeat usage patterns. Managers returning 3+ times weekly signal sustained engagement. Multi-turn dialogues (not single questions) show deeper problem-solving. Contextual engagement (proactive coaching moments vs. on-demand queries) predicts whether managers will sustain use beyond initial novelty.
Behavioral change metrics track specific leadership behaviors through 360 feedback, direct report pulse surveys, and manager self-assessments of confidence in difficult conversations. This proves managers apply what they learn, not just consume content.
Business outcomes monitor team retention rates, performance review score distributions, time-to-productivity for new managers, and manager NPS trends. These connect coaching investment to outcomes executives care about.
The vanity metric trap catches most organizations. 80% of managers logging in weekly means nothing if they don't apply what they learn.
Data Breakdown:
• Metric Type: Weekly Active Users | What It Measures: Login frequency | Why It Matters: Vanity metric (doesn't show application)
• Metric Type: Multi-turn Conversations | What It Measures: Depth of engagement | Why It Matters: Predicts sustained use and real problem-solving
• Metric Type: Direct Report Improvement | What It Measures: Manager behavior change | Why It Matters: Proves coaching translates to action
• Metric Type: Team Retention Rate | What It Measures: Business outcome | Why It Matters: Connects coaching to bottom-line impact
• Metric Type: Manager Confidence Scores | What It Measures: Self-reported capability | Why It Matters: Shows skill development trajectory
Traditional coaching ROI relies on quarterly surveys and annual performance reviews. These low-fidelity snapshots miss real-time behavior change. AI coaching platforms embedded in workflow capture continuous behavioral data, showing what managers do (not what they remember doing months later).
Traditional coaching costs $200-500 per hour, limits access to executives, and measures impact through delayed self-assessments with no visibility into daily application. According to Gartner research, HR leaders cite "demonstrating value and impact" as a top-3 priority, yet traditional coaching offers limited measurement capabilities.
AI coaching scales to all managers at lower cost, provides real-time feedback loops, captures observable behavior patterns, and enables immediate correlation between coaching and outcomes. The data fidelity gap: annual engagement surveys provide 1-2 data points per year; AI coaching observes thousands of interactions.
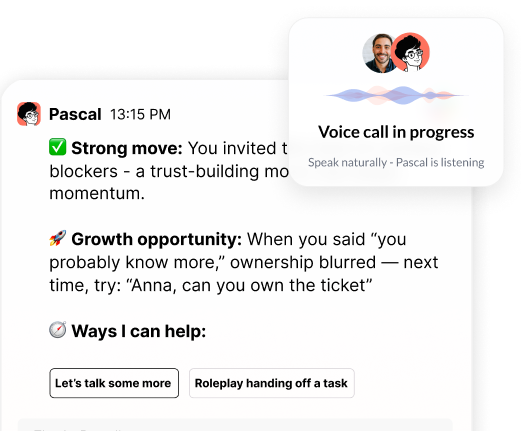
Pascal joins meetings (with participant consent) to observe real leadership moments, provides post-meeting feedback customized to individual goals, and tracks progress over time with quantitative scoring. This shift from periodic self-reporting to continuous observation provides CFO-friendly proof points that traditional methods can't deliver.
Important caveat: Modern executive coaching already uses 360 feedback, behavioral observation, and continuous check-ins. The comparison here is to traditional quarterly survey approaches, not best-in-class coaching programs.
Focus on adoption signals that predict long-term success: managers using the coach 3+ times weekly, engaging in multi-turn conversations (not just one-off questions), and applying coaching in real situations (meeting prep, feedback delivery, conflict resolution).
Week 1-4 benchmarks (based on typical implementation patterns we observe): 60%+ of target population activates accounts, 40%+ engage in first coaching conversation, average 2-3 interactions per active user. This establishes baseline engagement and identifies early adoption barriers.
Week 5-8 benchmarks: 50%+ of activated users return weekly, conversation depth increases to 4+ turns per session (a "turn" means one manager question and one AI response), managers report using coaching for real workplace situations. Sustained engagement signals the platform solves real problems.
Week 9-12 benchmarks: 30%+ of users become "power users" (5+ weekly interactions), direct reports notice manager behavior changes, specific use cases emerge (1:1 prep, performance conversations, delegation). Behavioral change becomes visible here.
Red flags to watch: High activation but low return usage indicates poor onboarding. Shallow conversations suggest generic AI, not contextual coaching. Concentration in single departments indicates lack of cross-functional value.
FAQ: What are realistic 90-day adoption benchmarks for AI coaching?
Expect 60% activation in week 1, 50% weekly return rate by week 8, and 30% power users by week 12. Direct reports should notice manager behavior changes within 90 days.
Behavioral change requires evidence from multiple perspectives: manager self-assessment, direct report observations, and objective performance data. The most compelling proof comes from direct reports answering "Has your manager improved in the past 90 days?" combined with specific examples of changed behaviors.
Direct report pulse surveys ask specific questions: "My manager provides more actionable feedback than 90 days ago" (5-point scale), "My manager's 1:1s have become more valuable" (yes/no/same), and "I would recommend this manager to a colleague" (NPS). These questions capture observable behavior change from the perspective that matters most.
Manager confidence assessments track self-reported confidence in difficult conversations, delegation effectiveness, conflict resolution, and performance management. Rising confidence scores that correlate with direct report observations validate that managers build real capability.
Pascal's behavioral tracking analyzes meeting transcripts (with participant consent) to score specific competencies (active listening, clear communication, inclusive decision-making) across meetings over time. This provides objective data on leadership behaviors.
The comparison trap: Don't compare AI coaching users to non-users without controlling for selection bias. Early adopters are often already high-performers. Instead, measure before-and-after changes within the same population.
Real example: When a mid-level engineering manager at a Pascal customer used the coach to prep for a difficult performance conversation, the platform analyzed her previous 1:1 transcripts and identified a pattern of avoiding direct feedback. After three coaching sessions, her direct reports reported in the next pulse survey that feedback quality had improved. The meeting transcripts showed measurable increases in specific, actionable feedback statements.
Connect AI coaching to outcomes executives care about: manager retention (reducing replacement costs of $50K-150K per manager), team retention, time-to-productivity for new managers, and performance review score distributions.
Manager retention matters because replacing a manager costs 50-150% of their salary when you factor in recruiting, onboarding, lost productivity, and team disruption. AI coaching that improves manager effectiveness and career satisfaction reduces this costly turnover.
Team retention provides stronger ROI. When managers improve their leadership capabilities, their direct reports stay longer. Organizations using Pascal report team retention improvements, though isolating coaching's specific contribution from other variables (training programs, market conditions, selection bias) requires careful analysis.
Time-to-productivity for new managers compresses when AI coaching provides real-time guidance through their first difficult conversations, performance reviews, and team conflicts. Reducing ramp time from 6 months to 3-4 months means managers contribute value faster and make fewer costly mistakes.
Performance review score distributions show whether coaching improves manager effectiveness at scale. Look for upward shifts in ratings, reduced variance (more consistent performance), and correlation between coaching engagement and performance outcomes.
Critical attribution challenge: Managers who use AI coaching might also attend leadership training, work with HR business partners, and read management books. To isolate coaching's specific contribution, consider:
• Cohort analysis: Compare managers who started in the same month, controlling for tenure and department
• Regression approaches: Use statistical models to control for confounding variables (prior performance, team size, department)
• Staged rollout: Deploy coaching to different groups at different times, creating natural comparison groups
The key is connecting these outcomes to coaching engagement. Segment your analysis by usage levels: power users (5+ weekly interactions), regular users (2-4 weekly), occasional users (1 weekly), and non-users. This reveals the dose-response relationship between coaching and outcomes.
Translate coaching metrics into business language: cost avoidance, productivity gains, and revenue impact.
Start with cost avoidance. Calculate the fully-loaded cost of manager turnover (recruiting, onboarding, lost productivity, team disruption) and multiply by the number of managers retained due to coaching. For a 100-manager organization with 20% annual turnover and $100K average manager cost, reducing turnover by 5 percentage points saves $500K annually.
Productivity gains come from faster manager ramp time and improved team performance. If AI coaching reduces new manager ramp from 6 months to 4 months, that's 2 months of additional productivity per manager. For 20 new managers annually at $100K fully-loaded cost, that's $333K in productivity gains.
Revenue impact connects coaching to customer outcomes. Sales managers who improve coaching skills drive higher team quota attainment. Customer success managers who handle difficult conversations better reduce churn. Engineering managers who delegate effectively ship features faster.
The comparison framework matters. Don't compare AI coaching to doing nothing. Compare it to the alternatives: traditional coaching ($200-500/hour), leadership development programs ($2,000-5,000 per participant), or unfilled HRBP positions ($120K+ annually).
Present a simple ROI calculation: Total annual cost of AI coaching platform / (Cost avoidance + Productivity gains + Revenue impact) = ROI multiple. Account for implementation costs, training time, and the 90-day ramp period before business outcomes materialize.
The biggest mistake is measuring activity instead of outcomes. Tracking logins, conversation counts, and satisfaction scores tells you nothing about whether managers are improving. These vanity metrics create false confidence that the investment is working.
Another error is expecting immediate business outcomes without tracking leading indicators. Retention and performance improvements take time to materialize. If you're not tracking adoption patterns and behavioral change in months 1-3, you won't understand why business outcomes do or don't appear in months 4-6.
Organizations also fail to segment their analysis. Averaging results across all users masks the real story. Power users might show 40% improvement while occasional users show 5%. Understanding this distribution helps you identify what drives sustained engagement and impact.
The attribution problem trips up many measurement efforts. Isolating coaching's specific contribution requires thoughtful analysis, not just correlation. Use the cohort analysis and regression approaches described above.
Organizations measure too late. Waiting until annual performance reviews to assess coaching impact means you've lost 12 months of optimization opportunity. Monthly pulse surveys and quarterly behavioral assessments provide the feedback loops needed to improve outcomes continuously.
How to avoid these mistakes:
• Set up monthly dashboards tracking adoption, behavior change, and business outcomes
• Run quarterly direct report pulse surveys asking specific behavior change questions
• Create control groups or use staged rollout to isolate coaching effects
• Segment analysis by usage level to understand dose-response relationships
• Present results in business language (cost avoidance, productivity, revenue) not HR metrics
• Real AI coaching impact shows up in three levels: adoption patterns (3+ weekly uses, multi-turn conversations), behavioral changes (direct report observations, manager confidence), and business outcomes (retention, performance, productivity)
• Traditional coaching ROI relies on quarterly snapshots; AI coaching embedded in workflow captures continuous behavioral data showing what managers do
• Focus first 90 days on leading indicators: 60% activation week 1, 50% weekly return rate week 8, 30% power users week 12, with direct reports noticing improvement
• Prove behavioral change through multiple perspectives: manager self-assessment, direct report pulse surveys, and objective performance data from meeting observations
• Translate coaching metrics into business language: cost avoidance from reduced turnover, productivity gains from faster ramp time, revenue impact from improved team performance
• Isolate coaching's contribution using cohort analysis, regression approaches, or staged rollout to control for confounding variables
Ready to prove your coaching investment is working? See how Pascal delivers measurable manager improvement with real-time behavioral data, direct report feedback, and business outcomes.
Header photo by Christina @ wocintechchat.com M on Unsplash

.png)
.webp)
“Thank you for setting the great foundation for my promotion; now I have a plan!"

Curious to see how AI Coaching can 10X the impact and scale of your development initiatives. Book a demo today for: